Group 4 Project Evaluation Day

During these 3 days of group 4 project, I was really pulled back into the environment and enjoyment of doing experiment in the lab wearing lab coats. Since the moment I chose physics for science, I have never been into the lab. It was exciting for me to put on the lab coat and gloves again with fancy lab equipments in hands. So, for me, doing experiment is itself an interesting task and I enjoyed it a lot. Especially when I was grinding the crab meats, the crispy sound would never make me feel boring. I also surprisingly enjoyed the process of shelling the crabs, although it looked disgusting. Before this project, I was the kind of person who would like to give up the delicious crab meats just because of the difficulty of shelling crab shells. But during the project, I even shelled all the main body parts of the little crabs, hundreds of them, on my own! This was a huge personal improvement for me and I overcame with my laziness. Furthermore, I also overcame my disgust of the gross smell of our experiment produced by the crab and tomato mixture. Actually, no one from our group escaped from responsibilities because of the gross experiment. Instead, we were all friendly and helpful, and always wanted to give a hand. I was really impressed when Ella put her own hands into the giant beaker to mix up the smelly, slimy mixture evenly and when Peter heating the mixture while stirring it without a mask. They just took these responsibilities spontaneously. Such teamwork spirit really impressed me and I appreciated all my teammates’ efforts.

Group 4 Project Poster final副本.jpeg
poster design (without QR code)

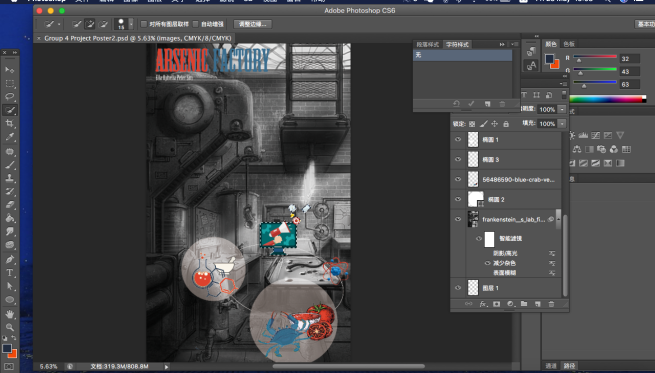
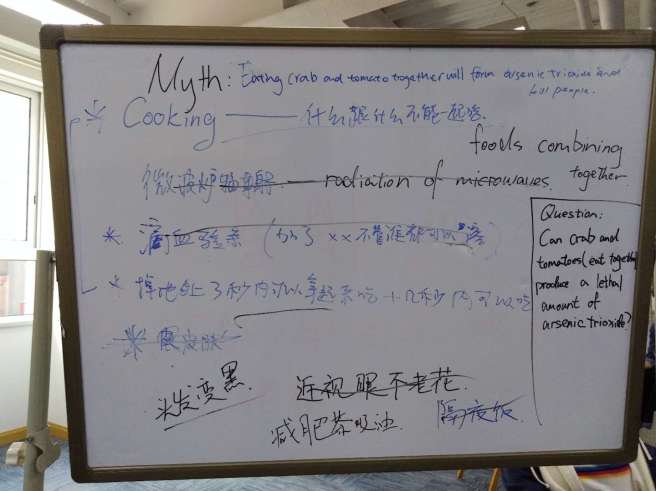
Personally speaking, the most significant contributions I gave were probably the research topic (the myth) and the poster design. These two parts of the project were also the reasons why I was motivated throughout the entire project as well. I was inspired yo research about this particular myth by one of my chemistry teacher in grade 9. I still remember that on the first day of his class, which was also my first chemistry class, he told us some interesting applications of chemistry in real life. One example was that he said only if you eat a truckload of seafood will you be poisoned (according to all these kinds of myths). Now I got a chance to testify his saying in group 4 project and this memory motivated me to find out the result. And, as a visual art student, needless to say, I am relaxed and engaged when making posters. I also enjoyed to discuss and design our group video with Ophelia. I think, for us, making fancy visual expressions were more important and exciting than anything else. (Although I think it’s really a pity that some video clips we recorded and some ideas were not applied in the final video reflection. I also feel sorry that some space in the poster is not well-used and the application of 4 sciences are not comprehensively explained due to lack of space. )

Without these motivations, I may possibly be lazy and loaf everywhere. I am also thankful that I had such great teammates and I appreciated the time we spent together. I could always get along well with Ophelia and Ella. When we were dealing with the crabs and grinding them, we worked as a chain efficiently. Although the work seemed boring and exhausting, we joked around and discovered fun from it. It was my teammates who made the tasks enjoyable and the entire project lovely. I didn’t have much personal contacts with Peter before, but this time I saw a lovely and responsible Peter who would do all the preparation and research silently and was willing to help us at any time. I think what’s great about our group’s collaboration is that everyone was willing to engage and give a hand to help, and everyone was doing their strengths. For example, the visual art students (Ophelia and I) were in charge of all the designs of videos and posters, and then Ella and Peter helped for the texts. When we were dealing with the crabs, Peter helped setting up the apparatuses and do research online preparing other needed solutions, which were tasks that he could definitely manage better than dealing with crabs, and we could of course do better on handworks. In this way, everyone felt comfortable and were efficient doing their own parts.

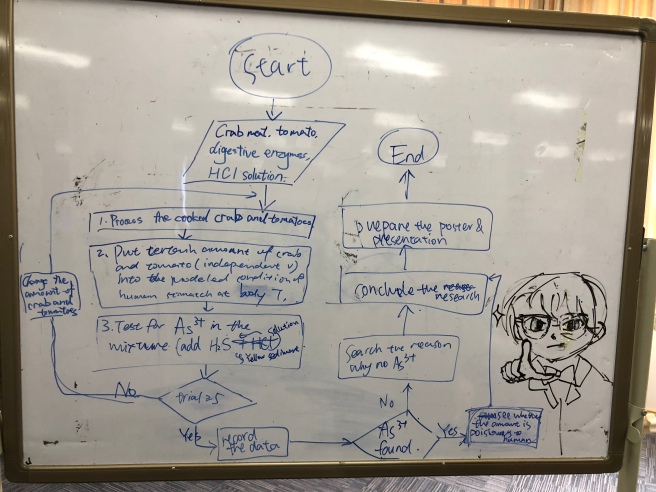
During these days, I also found the usefulness of reflections. These reflections kept reminding me our project’s process and force me to always think back and plan ahead. So that I could make improvements and adjust any procedures in time and quickly. As a person with poor memory, reflections are the best sources for me to review our procedures and go through our entire project. More specifically, reflections let us really think about what our experiment would be at the end of the first action day. If the test trial didn’t go well, we could only make our experiment qualitative (as shown in our action day 1 reflection). This reflection helped us to plan ahead for our action day 2 and keep our experiment in track and in time.

Group 4 Project Action Day 2 Reflection

In general, our group successfully reached our target for today. Today we finished our experiment and started to do writing tasks, edit videos and design posters. Our experiment finally had a result that the arsenic reagent paper turned to the lightest level of yellow, which means that there surely is a really small amount of arsenic in the mixture of crab meat and tomato. So that we can eventually draw a conclusion about our myth based on this sign.

Screen Shot 2018-05-25 at 19.03.01.png
Poster Design

I basically finished the art design of our group poster today. Making poster was really interesting for me. As a visual art student, just as I predicted yesterday, I was motivated to design the poster just because I really wanted our poster to be good-looking and fancy. The only thing annoying was that the rendering process of photoshop was really slow on my computer and it took ages for it to add filters on my background. Besides, I didn’t have a mouse paired up with my pc so it was annoying as well when I edited pictures in detail. Now the tasks left to do for me is to fill in all the writings when my teammates finished them and do the final adjustments of the poster design once all materials are filled in (also remember to leave a space of the QR code).

WechatIMG16.jpeg
Physics Introduction Video

As the “physics specialists” of our group, Ella and I also recorded a short video as the beginning of our introduction about physics applied in our project. Then we still need to record audio introductions to be edited with some pictures in our video.

Our group was surprisingly cohesive and friendly. We didn’t have any interpersonal conflicts at all. Although our experiment process was quite disgusting, we were all really responsible and were willing to do the “disgusting works” and cleaning jobs for our group. I am glad to be in the same group with them. I think the only problem of me in this project was that I couldn’t bear the disgusting smell of the final mixture. So that I couldn’t do the filtering job. So I spontaneously did the cleaning for our group.

Group 4 Project Action Day 1 Reflection

Today was the first action day of our Group 4 project. Basically we just started our project from 0 and aimed to testify the most appropriate ways to implement our ideas. A problem of our project was that we could not make sure whether our experiment should be qualitative or quantitative. It was because the amount of substance arsenic we could probably get from crab meats is too little to be tested (probably lower than 0.01mg). If we want to make our experiment a quantitative research, we need at least 5 trials, which means that the amount of crab meats for each trial is even smaller so that it’s even more impossible for us to see any sign of arsenic. Therefore we need to testify whether we can find arsenic quantitatively in part of our total crab meat. If not, we should make our research qualitative.

WechatIMG14.jpeg
Me and Ophelia Dealing with Cooked Crabs

When we started our experiment in the first place, we found out that the crabs that the school ordered for us were really tiny, little crabs. So we might have hundreds of little crabs in that 4500g crabs. In order to get crab meats, we need to get rid of all these solid shells and remain these main body parts for experimental use. So we immediately started to deal with the crabs on the morning. Ophelia was in charge getting rid of all the solid crab legs and give me the main body part, then I was in charge to open the shells of the crabs and take out the crab meats, and Ella was in charge grinding the crab meats into paste. In such an effective working chain, even out of my expectation, we finished the heavy workload even before the lunch break. After finishing my part of work, I also helped Ella grind the meats. To be honest, I actually enjoyed the process really much. It’s fun to do such simple works and experience the feeling grinding the crisp crab meats. I guess being exciting doing such work was also part of the reason why we were so efficient on the morning.

WechatIMG15.jpeg
Grinding the Tomato

In the afternoon we grind the tomatoes into paste so that we can mix it with the crab meat paste and put them into the imitated stomach conditions. We only mixed a small amount of crab meat paste with the tomato paste for experiment today just to test whether we should make our research quantitative or qualitative. After that we filtered the mixture and tried to see if arsenic can be tested quantitatively. But eventually we find it impossible. So we decided tomorrow we will just directly mix all the crab meat paste and tomato paste together and do it only for one trail to make the research qualitative. It means that we won’t be looking at the quantitative amount of arsenic in the mixture and find the percentage of arsenic, but to find whether there will be enough arsenic in the total mixture to kill people.

In addition, I and Ophelia also planned most parts of our video and we have recorded many materials already. I also started to plan our poster while waiting for the mixture to be filtered completely. I feel that the most motivated part of our experiment is to deal with the crabs and tomato. It was just fun to play with these materials and let my brain relax. However, the most motivated part has been done today. And the works went boring especially when filtering the mixtures since mostly what we could do was to wait. But I am still looking forward to making posters tomorrow. I am really excited to make a fancy poster for our group. So tomorrow my aim is to help my group setting up our experiment and design our group poster.


Planning Day Reflection

Today is the planning fay of the group 4 project. Our team consists of 4 members: Peter, Ella, Ophelia and I. Interestingly, we have no expert from the CS class, but three members learning physics. Ophelia was still in Europe today, so only we three discussed the possible topics we might choose. We thought about all kinds of topics even including blood testing and the myth that foods will still be clean enough to eat if it is picked up after dropped on the floor in 3 seconds. Brainstorming was difficult. We needed to come up with an idea that can include all 4 subjects and we should be able to apply scientific experiments based on its phenomena. After a really tough period of time filtering ideas, we finally decided to research on some most common myths in daily life —— food poisoning.

All the way back to ancient China, there have been myths about food poisoning that certain foods shouldn’t be eaten together or people will die because of food poisoning. For example, it is said that eating tofu and shallot will cause stomach stones, and eating shrimp with VC will result in poisoned death…… Among these myths, we were specifically interested in the myth that eating crab with tomato will form arsenic trioxide and finally kill people. It is one of the most accepted food poisoning myth in daily life and we wanted to test whether it is true. So our final research question is: Can crab and tomatoes eaten together produce a lethal amount of arsenic trioxide?

WechatIMG9.jpeg
Brainstorm and Final Research Question

After settled down the research question, we started to deeply think about our lab designs and what we can get from our experiment. Since the myth states that the poisonous substance is the arsenic trioxide formed by crab meat and tomato in human stomach, we certainly wanted to mimic that condition and find out whether it would actually produce a lethal amount of arsenic trioxide.

What we know now is that crab consists of As(5+) and the myth claims that the tomato acts like a reducing agent of it and they will form arsenic trioxide, which is called 砒霜 in Chinese, a highly toxic substance. But the problem is, the amount of As(5+) we can find in crab meat may be less than 0.1 mg per kilograms. It means we may not be able to extract the arsenic trioxide from the crab meat. Moreover, if we want to use H2S to react with the final mixture of crab meat and tomato after put in the modeled stomach, the yellow sediment formed by H2S and arsenic trioxide may not be visible and distinguishable for us. But we still have the hope that we may find test paper of arsenic chemicals according to what Ms. Elicia told us. Seems like some students used such materials last year.

I am really thankful that I can have my group mates with me as well. Peter was being really responsible on Chemistry knowledge during today’s discussion. And Ella even got an idea of our video’s content. And I found myself, surprisingly, still remember the skills of drawing flowchart very well.

Group 4 Flowchart.jpeg
Flowchart

I know that there are a lot of people believing in the myth we are going to test, so I believe our project’s conclusion will be helpful for people around us and all people in the society. Moreover, if the combination of tomato and crab meat is really harmful to human body in certain scale, our project can also warn people to care about their own health when eating.

CS Economic Project

The links of our work:

Presentation online (iCloud): https://www.icloud.com/keynote/013x1EEpSkHXTfu_5NAFp_ipA

Screen Shot 2017-06-12 at 21.21.34.png
Presentation

Spreadsheet online (Zoho):https://docs.zoho.com/sheet/ropen.do?rid=2um4289a0dcd97d8a4f25b84ebc7096e685b2

Screen Shot 2017-06-12 at 21.19.29.png
Spreadsheet

Personal Experience & Feelings

Personally, I really like my work and our effort, as a group, done to the presentation. I love the presentation I made really much and I think in my mind it is a kind of art rather than simply a homework or assignment. Basically, I did the presentation making, flowchart+Pseudocode making, background searching, and I also helped a bit with the spreadsheet formula. When learning spreadsheet in school, I just couldn’t help being amazed by the formula behind all the little cells. I think spreadsheet is a skill that will help one with his or her normal life a lot. For example, when comparing data and calculating data with the same method, usually people will just put all the numbers in calculator and then put all the results in a table. However, with the help of formula in spreadsheet, such things won’t even bother me again for I can just entering formula in spreadsheet just like what we did in this project comparing the GDP and McD indexes of selected countries.

I think the same is for presentation making. I know there are a lot presentation on how to work with iCloud. Yet I didn’t think that’s useful until this project. I was always bothered with the shift in styles and format when changing a keynote to a PPT or the reverse. This time, I just imitated the way that the presentation are given to us on the class webpage that people can collaborate with my presentation on viewing only. We encountered all kins of problems and difficulties in the process, however, we figured them out on our own. For instance, the flowchart is too long to put into a horizontal presentation, then I add an animation on it and made the duration of the animation long enough just for people to see the content clearly. I really enjoy the process of making a good looking presentation. I add gif and pictures from the official website and edit them to fit my presentation better. I made the gif loop back and forth and made some menu options using photoshop editing them with the same color and size. I really like this kind of work for I treat it as art. The process of trying and working things out are the things that fascinate me the most.

What to improve?

Basically, I think there are still a lot to improve on the skills of spreadsheet making. Some formula we used are not mastered steadily. For example, when applying a formula to cells in a row, the automatic change of the formula is supposed to be solved by adding a “$” in the middle if I remembered correctly. Yet it was not working. We also encountered problems making a graph. The problems were caused essentially for the sake of poor memory. We forgot how to do the tasks. Another example of the poor memory of us is that the problem we had making a pseudocode. The task of making a pseudocode was assigned to my partner initially, yet she had problem understanding and transforming the flowchart. After discussion about the translation, we decided to let me to write the pseudocode. During the process, I found that I almost forgot how to write a pseudocode! The solution to the problems are basically reviewing the presentations, which will also benefit for my final exam revising, and practice more. I think I will definitely meet the goals for I must do the review and I use spreadsheet in my science classes frequently.


Spreadsheet

  • Spreadsheet software
SS1.png
Spreadsheet. Digital image. N.p., n.d. Web. 20 May 2017. <http://www.okclipart.com/Formatting-a-Spreadsheet-Clip-Art30zndvfsvn/&gt;.

A spreadsheet is what called Excel or Numbers; it is a bunch of organized cells with rows and columns which can be used to enter and store data and do some basic instructions for the users.

  • Some real-life examples of how spreadsheet software can be used
Siri-Concentration vs. time graph.png
Numbers; used to imitate chemical reactions

A spreadsheet can be used to imitate chemical reactions for chemistry; profit and loss account for business; calculate and record students’ grades and so on. It can do some basic calculations with formulas or run some basic instructions with codes provided. For example, in the picture provided, which is my chemistry homework, the spreadsheet helped me to calculate the equilibrium of a reaction. In that case, I did not need to calculate very hard and enter the data into a bunch of cells by myself —— the spreadsheet did it for me! The data in a spreadsheet can also be used to draw corresponding graphs.

angry-birds-spreadsheet-art

It can also be used to express art as well! (work cited: Angry-birds-spreadsheet-art. Digital image. N.p., n.d. Web. 20 May 2017 <http://www.microsofttraining.net/b/spreadsheet-art-10-of-the-best/&gt;. )

  • Discuss some functions of a spreadsheet software
Screen Shot 2017-05-20 at 21.12.53
GPA Spreadsheet Calculation

It has many functions! If you enter “=” in a cell, it will consider the following input as instructions for it to run. It can add, minus, multiply and divide numbers and run equations. What’s more, it can also randomly pick numbers within a range if you enter “=random” and calculate the average by entering “=average”. It can also run some basic codes as shown in the picture above. The code can be entered into the cells and the instruction can be run automatically.

  • a screenshot of your work with some brief explanation
Screen Shot 2017-05-20 at 21.16.50
Siri’s spreadsheet

This is the spreadsheet that I made during the class and completed after class. It is basically about how to create a form that can do basic calculations and a series of instructions. In this spreadsheet, students’ grade are recorded, and GPA and average grades are also calculated. In this spreadsheet, functions such as IF, AND, RANDOM, AVERAGE and so on are used.

  • Conclusion

During the class, I learnt how to type a real code that can really function in real life. It was really exciting to see my code running. The amazing technology shocked me. I can no longer enter numbers in the cells one by one and do the complicated calculations on my own. I can simply drag the cells to copy the same instruction and enter the equations to calculate for me. After the first class, I immediately applied the skills I learnt and did on Zoho in Numbers. They have slight differences but they function similarly. I then quickly completed my chemistry homework imitating the reactions. I believe the skill is more than useful in the future. It can be applied in numerous fields.

Softwares

Hierarchy of Software

Screen Shot 2017-05-12 at 14.35.59.png
Hierarchy of Software


There’re two kinds of software which are the system software and the application software. System softwares can also be divided into operating systems, library programs and utility programs. The Application softwares are categorized into general-purpose application software, special-purpose application software and bespoke application software.


Difference between application software and system software

The system software is used to operate the computer hardware to run the application softwares. It is considered as the operating systems and platforms such as Microsoft or OS(for apple). Yet application softwares are designed to do specific kinds of tasks. For instance, the Photoshop, Pages and PPT are application softwares.


Different types of application software and system software

Screen Shot 2017-05-16 at 22.09.26
system software

The picture above shows the different types of system software.

As for the application software, it has 3 types in total, which are general-purpose application software, special-purpose application software and bespoke application software. General purpose software is more powerful. It can be used for several kinds of tasks. Keynote and photoshop are the examples of General purpose softwares. Yet special-purpose application softwares are used to only run a certain type of tasks. They can only do single tasks like the calculator. The bespoke application software is designed to run a specialized tasks that only focus on a specific purpose, which means this task is not used universally. The software we use in the MUN to record the meeting process is an excellent example.


Conclusion

In this week, we have learnt a lot about softwares and this was the first time that I was aware that there were so many different types of softwares. I used to think that all kinds of softwares are functioning in a really sophisticated way. However, I now find that some tasks are actually really simple and straight-forward. For example, a calculator seems much simple than when I didn’t know anything about CS before. All these types of softwares may be designed in different ways. They are all built up by codes and programming. I now understand the softwares better and can basically recognize the types of the softwares that I use.

CS Flowchart Poster

Flowchart + Pseudocode Poster

CS FC.jpeg
Poster-Flowchart
CS Pseudocode.jpeg
Poster-Pseudocode

This is the Flowchart poster made by myself. The topic is “Siri’s Plan for an Amusement Park.” It briefly describes the process of choosing what to play of me in an amusement park. I decided to do this because my friend and I just went to the amusement park several days before.

The whole precess looks like this:

I need to first enter into an amusement park. Then I would like to play a ride that is not terrifying and can make me relaxed. After that, I will play the roller coaster and gyro swing. I will repeat playing this 2 rides until I get satisfied or bored. Then I would like to go to the Kid’s Paradise. I will first play the mini drop tower there, and then play the bumper cars if I am not satisfied. After that, I will determine which and how many rides to play based on the time remained. Then I get out of the park.

Generally, I missed the input in the flowchart in the first time, and I misunderstood the usage of the rectangles and parallelograms from time to time. The pseudocode seemed to be okay. So I fixed the problems afterward and remembered that the parallelogram can only be used when there’s an input in my flowchart. 

Flow Chart

220px-LampFlowchart.svg.png
lamp flowchart; citation: en.wikipedia.org

Flowchart

Diagram that illustrates the sequence of instructions to be operated to get to the solution of a problem. Pseudocode and flowchart can be transformed from each other.

Flowchart symbols and rules

  • start with a “trigger” event
  • direction of the flow
    • should always be left to right, top to bottom
  • rectangular
    • calculations
  • parallelogram shape
    • one input one output
    • must be input/output something
    • if calculation, use rectangle
  • diamond shape
    • one input and 2 output

The sequence of a flowchart should be top to bottom and left to right. There should be a start point and an end point of a flowchart. A flowchart should be logic and finished.

  • IF, IF-ELSE, IF-ELSE-IF, and loopings in flowcharts
Screen Shot 2017-05-01 at 19.54.36.png
Flowchart & Pseudocode

This slideshow requires JavaScript.

  • IF —— 1 diamond shape
    • one output
  • IF-ELSE —— 1 diamond shape
    • 2 output
  • IF-ELSE-IF —— several diamond shape
    • several output
  • looping
    • while loop
      • 1 diamond shape- yes/no – loop/output
    • do-while loop
      • 1 diamond shape – yes/no – output/ loop+instructions

Flowchart activities with pseudocode

IMG_5976.JPG
flowchart – Pseudocode activities

This part let me know well about the relationship between pseudocode and flowchart.

WechatIMG8.jpeg
Activity 5/6 (didn’t do in class)

Assignment 1

WechatIMG14.jpeg
Flowchart & Pseudocode poster

Assignment 2

This slideshow requires JavaScript.

http://www.bbc.co.uk/education/guides/zp92mp3/revision/2

Computational Thinking

  • decomposition
    • break down a complicated problem
  • pattern recognition
    • look for similarities among problems
  • abstraction
    • focus on important parts, relatively ignore what’s less important
  • algorithms
    • come up with a step-by-step solution to the solve the problem

After reading this webpage, I finally understand the concept of computational thinking clearly that it helps us solve a problem more efficiently and easily.

Computational thinking is not the same as programming. It makes you able to know what to let the computer do. Yet programming tells the computer what to do and how to do. For me, computational thinking is more like coming up with ideas that can solve a problem more efficient and programming is more like following instructions. I think computational thinking can be used in real life broadly. For example, when driving, there are always several routes that all are capable to go to the terminal. However, if you can think step by step, you can find the route that will take least time by thinking whether there is less traffic lights, less cars passing by each day, whether there is no parks near by and so on using past experiences.

Algorithm/Pseudocode

Algorithm

algorithm-27863175
Algorithm

Algorithm is “A step-by-step clear instruction to solve a problem”. Algorithm needs to be clear and specific. It has to come up with, turn into something, or to achieve something. It is the instructions that the computer should follow in a specific order to work out a task.

LightBot Exercise

This slideshow requires JavaScript.

When playing this little game I was just considering it as a game rather than an assignment. So it was really easy for me to love this playing process. In the beginning it was easy. However, it is difficult to imagine the robot’s movement and direction before actually running the procedures. It is amazing how the combination of loops works as well. From this little game, I understand how loops work in a concrete way.

Properties of Algorithm

  • Finiteness
    • An algorithm must terminate in a finite time.
  • Definiteness
    • The steps of an algorithm must be precisely defined and specified.
  • Input
    • Qualities given to the algorithm before it begins.
    • It is usually taken from specified objects.
  • Output
    • Quantities which has a specified relations with the input.
  • Effectiveness
    • The efficiency of an efficient algorithm should not take a long time and the task should be done within the time a person use pencil and paper to solve.


Understanding the Problem

Before creating an algorithm, there are some factors that should be considered.:

  • What’s the input? (for example, a number, or a word)
  • What will be the output? (for example, a sentence)
  • What’s will be the order of the instructions?
  • What decisions should be made in order to solve the problems?
  • Are any part of the task repeated? (maybe a loop can be created)


Expressions for Algorithm

  • Natural Language
    • continue to do the steps?
  • Flow Chart
  • Pseudocode —— What we are learning!!! 😀
  • Programming Language


Pseudocode explanations and exercises

Screen Shot 2017-04-18 at 15.05.42
My Pseudocode Exercise